In today’s digital age and with all the marketing technology tools marketers have at their disposal, it’s easy to get bogged down in the data available to you.
However, data isn’t useful unless it provides insights to help you improve your demand generation program.
But that doesn’t mean it’s easy. If you were to make a list of every metric you could track, it would quickly become overwhelming.
Paralysis by analysis.
Out of all the demand generation metrics you can use, here are the most useful ones to track to help improve your demand generation strategy.
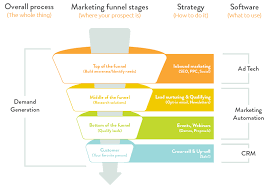
Demand generation is a broad term to describe how a business acquires a customer and then maximises revenue from that customer.
Unlike lead generation, which is focussed on acquiring a lead, a demand generation strategy goes much further, covering everything from building awareness, generating a lead, converting the lead and then up-selling the customer to purchase more.
And because of the importance of demand generation, it’s common for the fastest growing B2B Tech companies to hire a marketer who’s focused on it.
The marketer will be responsible for building and executing the demand generation plan, and work very closely with the CEO, senior leaders and the sales team, to make sure there’s alignment.
We’re not short of definitions in business. So it’s important to define what the difference is between a goal, a strategy and a metric, because if you’re a marketer, you’ll have to work with all three.
Goals are desired outcomes. And the senior leadership team or Founder will typically set those goals.
As an example, a goal could be;
A strategy is then the plan which is created to help the business achieve its goal. And this is where a senior leader will create a plan so that their department can support the business in achieving those goals.
And lastly, a metric is how you measure the success of the strategy. Metrics will be used across all areas of a business, where you could be measuring operational performance, customer satisfaction, product success or market penetration.
Hiring? Market Recruitment is a specialist demand generation recruitment agency.
Before we dive into the demand generation metrics, it’s worth us clarifying what a marketing metric is.
As a B2B marketer today, there are so many channels available for you to use. From social, to email marketing, to PPC, to webinars….so depending on what marketing channel you decide on, it’s important to keep track of the performance of that channel.
And you would do that through a marketing metric.
How granular you get, will depend on the level of your role within the organisation. If you’re the CMO, then you’ll want a high level view of every metric. But on the other hand, if you’re a performance marketer, you’ll want a deep understanding of every metric related to that
Additional Reading –The Complete Hiring Guide for Demand Generation Jobs
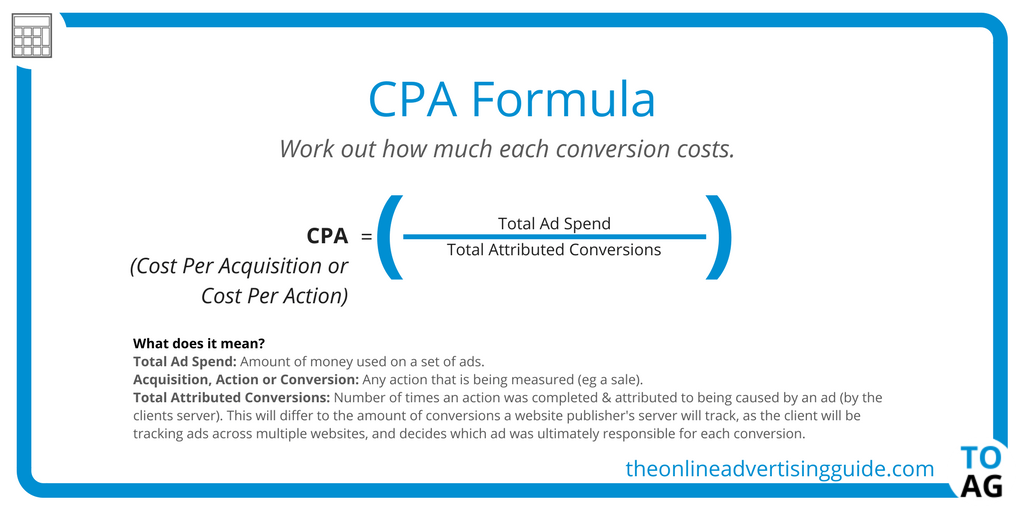
Customer Acquisition Cost (CAC), or Cost Per Acquisition (CPA), is one of the most important marketing metrics you can measure. Especially when you combine it with your Customer Lifetime Value (CLV).
Often marketers can be guilty of talking about engagement metrics. Think website traffic, blog post views or email opens to name a few. But, unlike engagement metrics, CAC tells you how much it costs you to win a new customer.
And that’s key in knowing whether or not a channel or marketing tactic is commercially viable. If you’re a product-led business selling email marketing software for £10/mo and your CAC is £100, it’s going to be a long time before you get payback and become profitable.
Fortunately, CAC is ever changing, so before discounting a channel or tactic too early, it’s worthwhile seeing if you can reduce your CAC.
It’s also worth considering going one step further and measuring the cost to acquire a customer for each marketing channel or marketing tactic you use.
Sometimes this can be a little too complex, because today’s modern B2B marketer will create integrated campaigns to generate leads and sales that will involve a variety of channels.
It may be a LinkedIn advertising campaign that drives people to a webinar, you then send some content on email and then they start consuming other content on your website and end up downloading an e-book. They then notice your Podcast and start listening to that, before seeing your brand at a trade show. It’s then when they walk up and engage with a sales rep.
So a solution to that is to measure attribution. What channel generated the lead in the first place.
However, measuring Customer Acquisition Cost Per Channel is still important, because it gives you an understanding on whether a channel is working or not.
CAC is simple to calculate. All you have to do is divide the total amount spent on acquiring the customer, by the number of customers you’ve brought on in that time period.
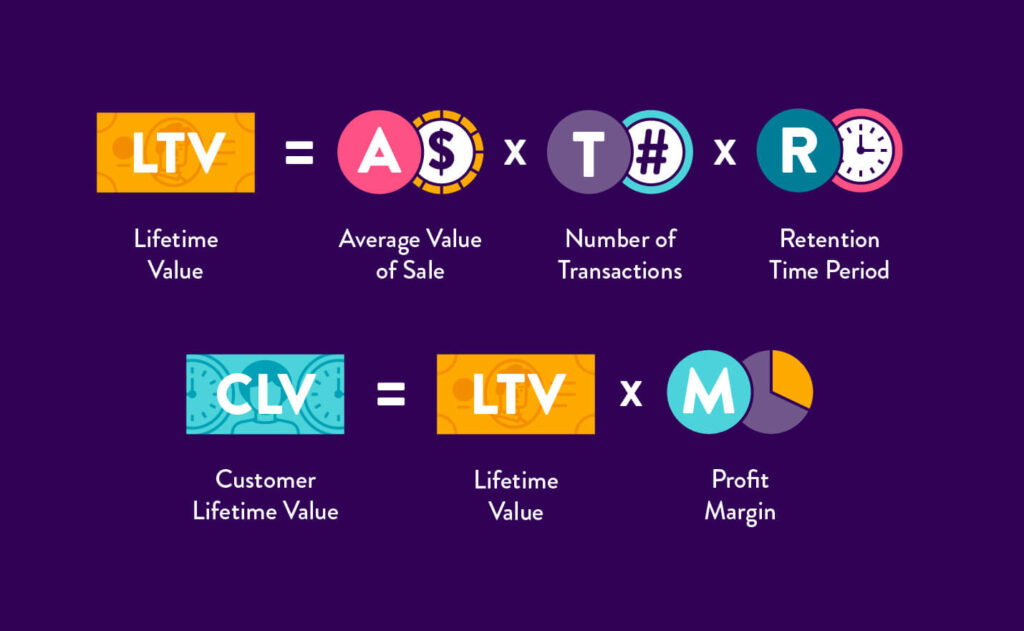
Customer Lifetime Value (CLV) is the amount of revenue you get from a business while they’re a customer.
It’s a critical marketing metric because you can use it to help inform your marketing strategy and also use it to project future revenue.
And it’s even more powerful when you combine it with your Customer Acquisition Costs (CAC).
As an example, if through your paid social campaigns, your CAC is £100 and CLV is £1,000, then it’s a channel that’s proving profitable and worth investing more in.
More tricky if you’re a Startup, because to calculate CLV you’ll have to make some assumptions. However, if you’ve historical data, it’s an easy calculation to make.
First of all you have to calculate the average value of a sale, then multiply that by the number of transactions a customer makes and again by how long they remain a customer for.
You then take that figure and multiply it by the average profit margin for a customer to give you your CLV.
Further Reading – 10 Best Interview Questions to Ask a Demand Generation Marketing Manager
Ever the contentious metric between sales and marketing, but a commonly used metric nonetheless.
And one that’s frequently used in conversations by Demand Generation Marketing Managers today.
So why contentious?
Well, it depends how you define what an MQL is. And that will vary from company to company.
It may be that you define an MQL as someone who’s downloaded a white-paper and attended a webinar. By doing those two things, it’s given them a score in your marketing automation platform, and they become an MQL.
Essentially, an MQL is a lead that’s shown interest in what your business has to offer. And because of that, they’re more likely to become customers.
It’s a worthwhile metric to measure because it gives a Demand Generation focussed marketer, something to work towards. Of course, in isolation, it means nothing. MQLs without intent are worth nothing.
But measuring the number of MQLs you’re generating helps when you start to pair that with other metrics, as we’ll talk about shortly.
Rather than being a calculation like our previous metrics, defining what an MQL is is more subjective.
So instead of doing this in isolation, it’s important to sit down with sales to understand what they view an MQL to be. And then pair that information with what you believe your persona’s to be, while diving into the CRM to see if this information is true.
A CRM doesn’t have bias when it comes to who is a customer and how they become one.
Once you have all this information, you can start to define the criteria for what an MQL is. And then each quarter, you can revisit this to make sure it remains relevant.
Similarly to MQLs, Sales Qualified Leads (SQLs) don’t necessarily predict or mean anything in isolation. Because you have 100 SQLs, it doesn’t necessarily mean you’re going to win revenue from them.
However, it’s an important demand generation metric to measure. Partly because it helps focus your demand generation marketing team on driving quality leads, and partly because you can pair it with other metrics to drive more meaningful insights.
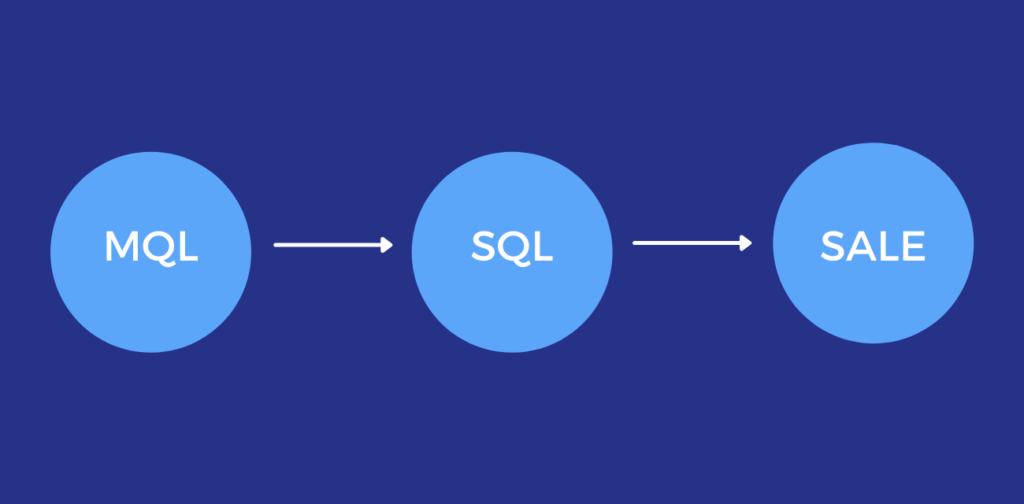
A Sales Qualified Lead (SQL) is a prospect that’s ready to talk to your sales team. Typically they’ll have engaged with your business and be familiar with what you offer, so it makes sense to progress them further down the funnel.
This will vary from one company to the next and be determined by what you’re selling, the average deal size, who you’re selling to.
But when you’re determining when an MQL becomes an SQL, consider the following;
Lead Score – as a prospect enters your funnel, you assign a score to them as they interact with your brand. And between you and the sales team, you need to agree a score whereby the lead is handed from marketing to sales because you deem them engaged enough.
Lead Behaviour – what a prospect does while in your funnel is important too. Because not all actions are created equal. Attending a webinar shows more commitment than opening an email, as example. So it’s important to weight lead scores based on behaviour too.
Buying Intent – there are plenty of people that exhibit classic ‘buyer’ signals but have no intention to ever buy. They may be consuming your content because they’re a competitor or someone looking to learn. So it’s crucial to clearly define your persona’s with the sales team so that any leads that fall outside of that criteria are not progressed from MQL to SQL.
Measuring conversion rates put more meaning behind the raw MQL and SQL metrics. Because all good and well generating MQLs and SQLs, but what really matters is, do they close?
So as well as measuring volume at each stage, it’s also important to measure the conversion rates from one stage to the next in your demand generation funnel.
Common conversion rates to measure include;
Of course, depending on your sales cycle you can also add in extra metrics that include conversion rates from proposal, or conversion rates from demo.
Conversion rates are easy to calculate. As an example, to calculate conversion rates of MQLs to SQLs you’d;
(Number of SQLs / Number of MQLs) x 100 = Conversion Rate
The average value of each new prospect closed within a time frame gives you your average deal size.
It’s important to measure because it gives an insight into how effective your demand generation strategy is, particularly if you sell to different sizes of customers or have been testing different pricing models.
Ultimately, if you can increase the size of each deal, then your business will grow without even generating more customers.
And it may be the case that you measure average deal size for each market vertical you sell into (Retail, Financial Services, Government), or measure it by the segment you sell into (SME, Mid-Market, Enterprise), or both.
Lastly, it’s also worth measuring the growth that you’re seeing in your demand generation pipeline.
This metric is of particular interest if you’re in Marketing Operations, because they’re tasked with optimising the funnel.
But it’s also important for all marketers involved in demand generation to be aware of it.
Ultimately, you want to understand how your pipeline is scaling, how leads can be influenced in the middle of the funnel stage, and what channels work well together when you’re planning an integrated demand generation strategy.
There are a few ways to measure Pipeline growth.
You could simply measure growth for a particular time frame;
(Total Value of Pipeline this month / Total Value of Pipeline last month) x 100 = Pipeline Growth
Or you can also pair that with how quickly a lead moves through your funnel. This is a better way because it’s easy to grow your pipeline of none of the leads close. And of course, closing a lead is what really matters.
It’s easy to get bogged down in metrics, analytics and attribution, and ultimately how your business stacks up against the rest.
Often people talk about industry benchmarks, but why should you aim for a benchmark. Why not surpass the benchmark? Or, if you’re an early stage business, maybe the benchmarks are out of reach right now. In that case, it’s far more important to focus on making incremental improvements.
Whatever metrics you decide to use to measure the effectiveness of your demand generation strategy, don’t expect overnight success. Success in demand generation is often compounding, so pick a tactic or channel at a time, measure it, and then move onto the next one when you’re happy it’s helping your business achieve its goals.
Subscribe to our fortnightly newsletter to hear about our latest podcasts, blogs, career advice & jobs.
While you can grow your organic reach on LinkedIn, integrating paid ads into your demand generation strategy is a far more effective way to reach a wider audience. And we’ll show you how…